Last modified Jan. 30, 2014 D. Nelson
This module dicusses how to make phylogenetic trees from multiple sequence alignments.
A sequence alignment can be useful for identifying conserved amino acids or motifs shared in common among many sequences. This may be useful in designing degenerate PCR primers to be used to find additional members of the family or it can be used to choose amino acids to mutate in experimental work on a particular gene. A sequence alignment contains much more information than that. All the sequences in a sequence alignment are assumed to be descended from a common ancestor, that is why they share sequence relatedness in the first place. From the time of the last common ancestor, the sequences have diverged. The sequence alignment has within it an approximate history of those sequences. This record can be extracted by making a tree showing the relationships between the sequences. If the sequences are from different species, this is called a phylogenetic tree. If the sequences are from a single species (like our 49 mouse mitochondrial carrier sequences), the tree does not represent phylogeny but the history of the protein family. This type of tree is often called a gene tree or a dendrogram.
This module will show you how to make several types of trees using a single sequence alignment. This area has been a controversial one, because the tree results can be used to infer the evolutionary history of groups of organisms. There have been very heated debates in the literature often running for years over such things as are humans evolutionarily closer to the chimp or the gorilla? This is not an issue now because more data became available and the question is resolved. When the data were sparse, debate raged over whose tree building method was the best and which results could you believe. Trees using different genes would often support opposite conclusions. More modern debates concern whether there was a single origin of modern humans in Africa about 200,000 years ago (mitochondrial Eve hypothesis) or are there other explanations (the multiregional hypothesis). Much of this argument hinges on the building and interpreting of trees of human mitochondrial DNA.
There are two main ways to build trees from sequence data. These are called distance methods and character-state methods. The distance methods use a difference matrix (or distance matrix) containing all the pairwise distances between all the sequences. We will talk about the UPGMA (Unweighted Pair Group Method using Arithmetic averages) and Neighbor Joining methods and these are both distance methods. Character-state methods keep track of the amino acid or nucleotide at a given site in a sequence. They start with the known sequences and attempt to reconstruct the history of changes that had to take place from a common ancestor. There are usually large numbers of ways to do this so these methods try to minimize the number of changes required to go from the common ancestor to the present day sequences. Each branch on a tree of this kind has a length equal to the number of substitutions (or mutations) required to get from one node to the next. The program looks at large numbers of possible trees and chooses those that have the shortest total number of steps. It is not uncommon that there may be a few hundred trees all with the same number of steps. In that case a consensus tree can be made. The character-state methods tend to be more computer intensive. These include parsimony methods such as PAUP (Phylogenetic Analysis Using Parsimony), PROTPARS and DNAPARS in PHYLIP. Maximum likelihood methods include ProtMl in the MOLPHY package and DNAML or DNAMLK in PHYLIP. Another character state method is the baysian network method implemented in the program MrBayes. This method is becoming more and more popular. There are more in the molecular evolution packages listed below (see MEGA and MacClade). In previous years we have used PHYLIP, but this year we are switching over to MEGA, a frequently used package for molecular evolution.
Distance methods can be used with any set of pairwise distances. These can be from non-sequence data. If you can measure anything between sets of related objects, like flowers, skeletons, cars, baseball players or gene expression on DNA chips, you can make a distance matrix and a tree. Character state methods can also be applied to discrete data like Restriction Fragment Length Polymorphisms (RFLPs) and skeletal features in fossils. Rob Edwards has recently counted the presence and absence of genes in 100 phage genomes and made a phylogeny of phage. This type of analysis is even applied to old manuscripts to detect the history of copying and editing changes over hundreds of years. Existing manuscripts of books like the Tale of Genji by Murasaki Shikibu (written approximately 1000 years ago) and the 84 different manuscript copies of Chaucer (see link1 and link2) are said to have lineages. For an explicit discussion of tree methods applied to the New Testament books see Views of New Testament Textual Space
Parsimony and Cladistics
The area of phylogenetics is mathematically rich. There are many different algorithms for computing trees and inferring phylogeny. As in any field, there are experts and they do not always agree on the best methods and they like to promote their favorites. This led to a running battle between cladistics and phenetics, two different phylogenetic approaches. A nice discussion of this is given by Fred Opperdoes here A simplification is that cladistics relies on parsimony methods and phenetics relies on distance methods. The question is what do you use and how do you decide? One site puts this very nicely as "...anyone with a copy of, say, PAUP* can learn how to "point and shoot" to make a neighbor-joining tree, or a cladogram or a likelihood tree, but this doesnt really mean you know what youre doing..." This page tries to give in depth explanations of the different methods, so you do know what you are doing. It suffers from lack of explanations for the uninitiated. It does link to another page which is the manual for the package MEGA. This seems to be a more detailed resource.
Parsimony adherents rather look down on distance methods as being too simple and unreliable, but here is a quote from the MEGA manual about this.
"Some authors (e.g., Farris 1981, Penny 1982) have argued that distance methods are inherently inferior to
discrete-character methods (e.g., parsimony methods), but their arguments are apparently based on misconceptions of distance methods (Felsenstein 1986, Nei
1987). Actually, some distance methods can be superior to discrete character methods in obtaining the correct tree, depending on the situation."
The cladistic approach is to define clades, organisms that are descended from a common ancestor. This is done by identifying shared derived characters called synapomorphies (characters that are shared in common by all members of the clade, but not by organisms outside the clade) For example, butterflies and moths both have scales on their wings so they are grouped together in the Lepidoptera. A fly would not be in this group. So this is an informative character. When looking at flies, moths and butterflies, they all have six legs, which is not informative, so cladistics would ignore that character. Phenetics is based on grouping organisms by similarity, and phenetics considers every character, so six legs is something that unites flies with moths and butterflies. In terms of sequence data, in a sequence alignment, a cladistic analysis would ignore all 100% conserved amino acids as not informative. A Phenetics approach would count them as part of the similarity between the sequences. These would go into computing the difference matrix. Technically, the tree generated by a cladistic approach is called a cladogram and it tries to be a true account of the history of the organisms, a genealogy. A phenetics based tree is called a phenogram. The phenogram and the cladogram may look the same, but thay are made from different treatments of the data. Cladistics has forced revisions to nomenclature. The term reptiles is no longer acceptable as a phylogenetic classification because it excludes birds. The term reptilia has replaced it and this includes the birds.
Biologists and molecular systematists are interested in the history of life and that is what they want to know from sequences. How can these sequences help in identifying the relationships among living things? There are layers and layers to this question, because it can apply to all life, just eukaryotic life or just artiodactyls in the mammals. I am interested in the evolution of eukaryotic life (see my pages on the Molecular History of Eukaryotic Life.
MHEL Before we can go further, we need to know some basics, such as what is a rooted tree or an unrooted tree.
A tree can be rooted or unrooted. A rooted tree has one node that is designated as the root and all other branches and nodes trace back to that node. This implies there is an ancestral relationship of that node to the other parts of the tree. There is a timeline to such a tree.
diagrams of tree nomenclature
An unrooted tree has no node that is designated as the ancestral node or root.
For unrooted trees the root could be on any of the terminal or internal branches, so there are always more rooted trees than unrooted trees. The number of possible trees grows exponentially with the number of sequences so for 10 sequences (often called OTUs = operational taxonomic units) there can be 34 million rooted and 2 million unrooted trees. To root an unrooted tree a node must be designated as the root. To do this, a new sequence can be added that is known to be distantly related to all the other sequences in the tree. For example, a beta globin sequence might be added to a tree of alpha globins. The divergence of alpha and beta globin is known to be older than the divergence of any alpha globin from any other. Therefore, the point where the beta globin branch joins the tree of alpha globin sequences is the root. This type of sequence is called an outgroup. All rooted trees, by definition must have an outgroup. The UPGMA method produces rooted trees, with the most distant branch being the outgroup. Because the UPGMA method uses mathematical averaging of distances, UPGMA assumes a constant rate of evolution in all branches. This is usually not true, so UPGMA is criticised as being too simple a method. Neighbor joining makes unrooted trees and does not assume constant rates of change. The longest branch is not necessarily the oldest branch on a neighbor joining tree.
The UPGMA method starts with a matrix of pairwise distances between all sequences. The smallest distance is found and these two sequences are then treated as a unit. The matrix is recomputed with the distances to the pair being replaced by the average of the two distances to the separate sequences. This results in an array that is smaller by one. The process is repeated until all the sequences are joined in clusters. The order of clustering is kept in the computers memory and this is the data used to make the tree.
The Neighbor Joining method is another distance method. It does not average the branch lengths at each step so the branches from the same terminal node do not have to be the same length. This feature allows for uneven rates of evolution. This algorithm seeks to cluster sequences in such a way that the total branch length of the tree is minimized. The tree starts out as a star, with all branches coming from a single point like spokes of a wheel. In the first step, the two most similar sequences (smallest distance between them) are joined. These are then treated as a single unit (a separate spoke on the wheel). The process is repeated, and the measure that is used is minimization of the total branch length. Neighbor Joining does not make a rooted tree, but designation of a root can be made if an outgroup sequence is included. The root is then the point where the outgroup joins the rest of the tree.
We will be using the MEGA package to make these types of trees. MEGA (Molecular Evolutionary Genetics Analysis) is a set of programs that are all related to molecular evolution. MEGA6 has been loaded on your computers with a shortcut link on your desktop. It can be downloaded for PC, Mac or UNIX machines free of charge (see link in the references).
MEGA has an online help manual.
MEGA can do sequence acquisition by selection of sequences from GenBank or by BLAST searching GenBank and downloading desired sequences into a sequence editor in MEGA. Today we will import sequences from a FASTA file. One weakness of MEGA is the import operation does not ignore numbers, so if your collection of sequences has nucleotide or amino acid numbering in it, these numbers must be removed before importing. Once the sequences are in the MEGA editor window, MEGA can align them by either CLUSTALW or MUSCLE.
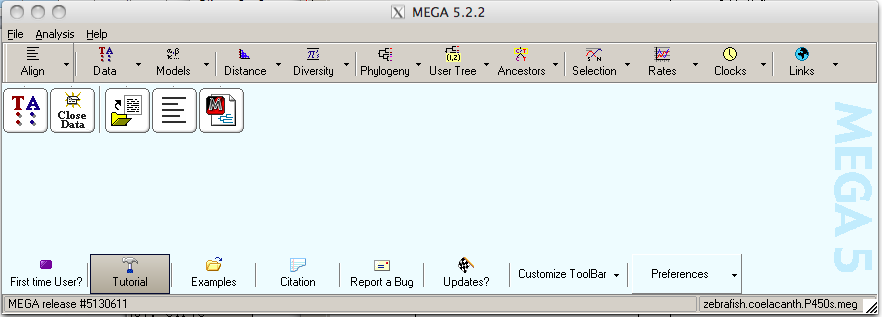
Here is the main window of the MEGA program.
If you click on file you will get a menu that says Open a File/Session. Clicking on that will give a dialog box to help you select a file to open. If you have a text file of FASTA formatted sequences, you can select that.
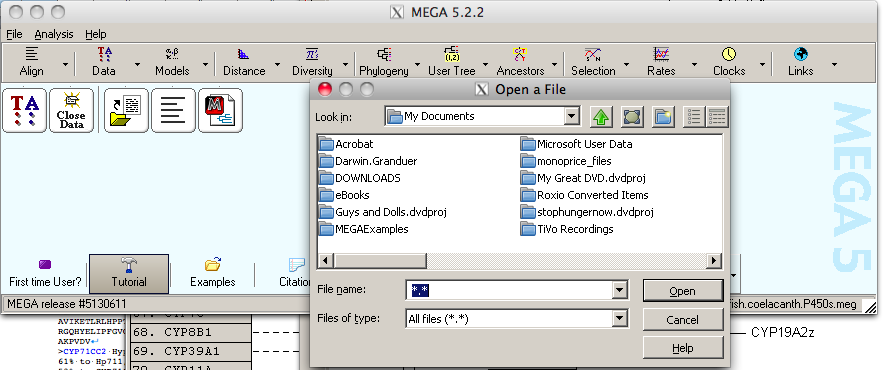
Once you have selected a file to open a small box will appear asking you do you want to analyze or align the sequences. By clicking align you will import the sequences into a sequence editor called Alignment Explorer (they will not be aligned yet, but that is the next step).
In the top bar there is a tab called alignment. Clicking on alignment will give a pull down menu that says align by CLUSTALW or align by MUSCLE. Go ahead and align by CLUSTALW for this example. The screen will say nothing is selected for alignment, select all? Click OK. Then there will be a parameter screen for the alignment program. Accept the defaults by clicking OK.
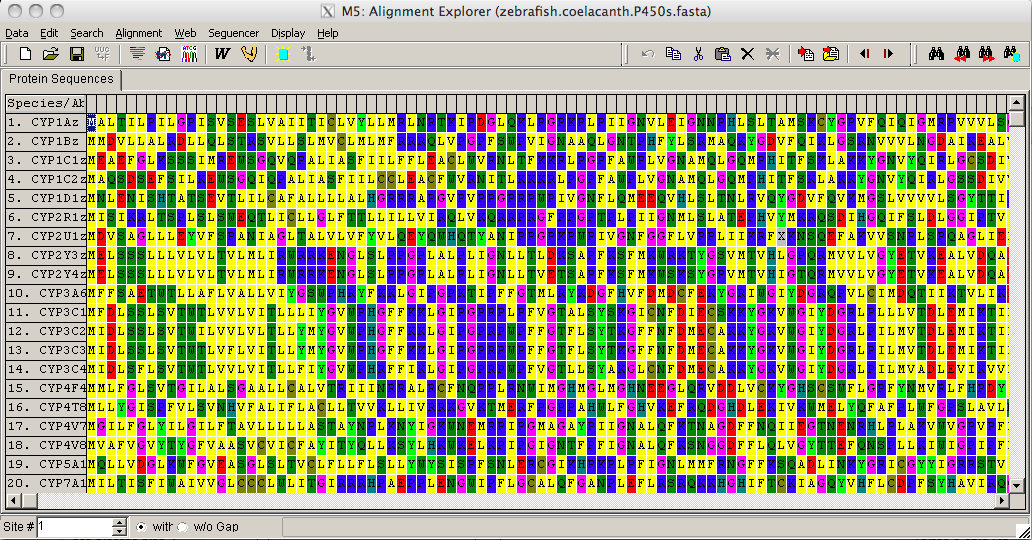
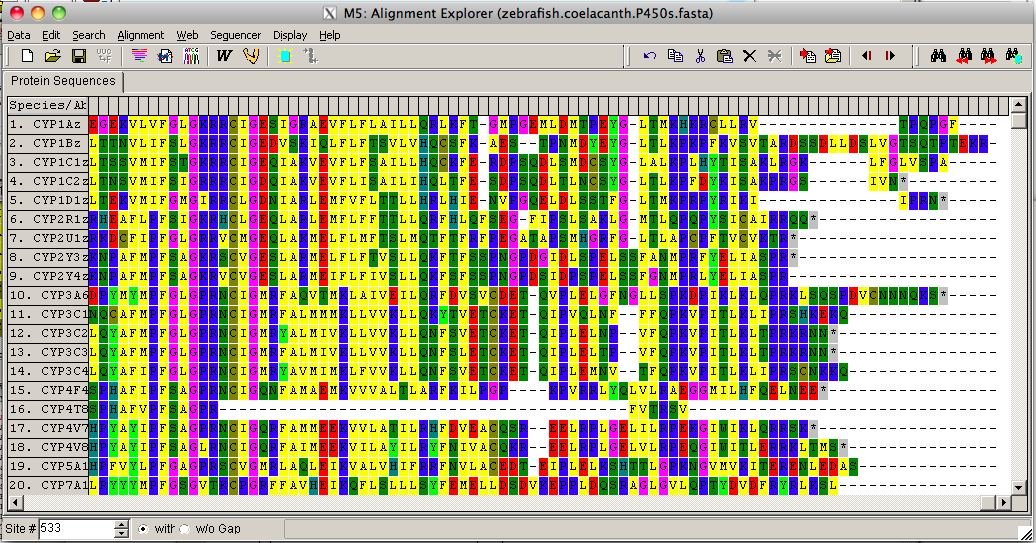
The program will start aligning the sequences There are two progress bars, one for pairwise alignments where all sequences are compared against each other to make a distance matrix, and the second bar is for assembly of the sequences into a multiple sequence alignment based on the distance matrix. The Alignment Explorer window will now display the aligned sequences. This section includes the heme signature region FXXGXXXCXG.
In order to build a tree we need to have this alignment in MEGA format. The top left tool bar on Alignment Explorer is Data. Click on data and scroll down to Export Alignment. You will be given three choices. Choose MEGA format .meg. This will save the file in your default directory (My Documents). Just above the Export Alignment option there is Save Session. This will save your aligned sequences in a Multiple Sequence Alignment (.mas) for later reuse and editing.
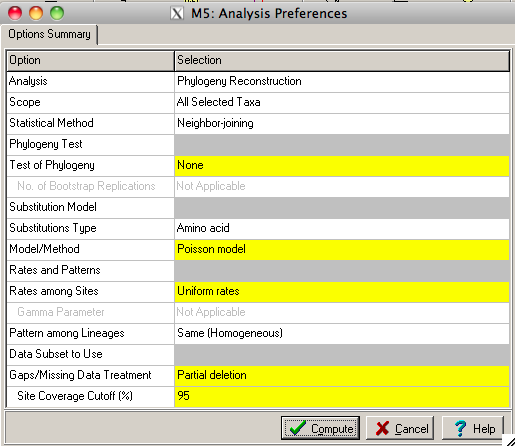
The main MEGA window has a tab called Phylogeny. Click on Phylogeny and it will give you five options for building a tree. For our purposes today choose Neighbor-Joining. This will prompt you with the question "Use currently active file?" You can choose yes or you can choose no and open any other .meg formatted file. The next window will be a dialog box with parameters for tree building. The only one you may want to change here is the Gaps/Missing data treatment option. If there is even one gap in a column the default will exclude that column from the tree making process. It is better to put in partial exclusion here, otherwise you might eliminate much of your alignment. Then click compute. A tree will appear in another window.
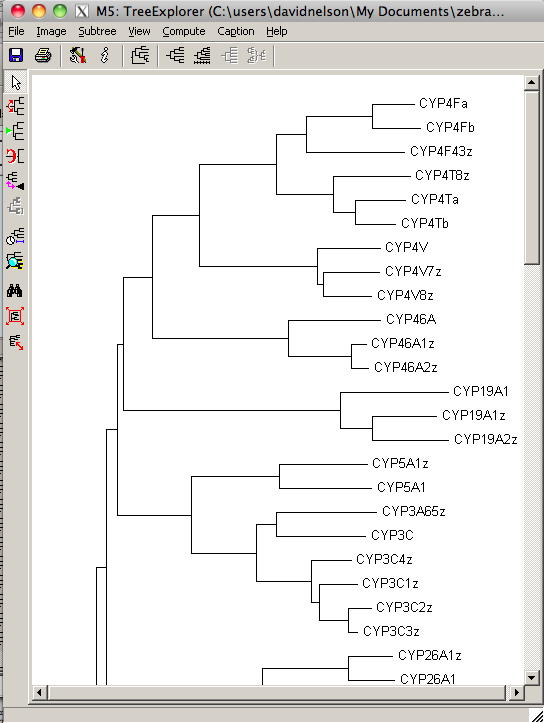
The TreeExplorer window will show a Neighbor-Joining tree built from the alignment you made with CLUSTALW using the sequences from your original FASTA file. The tree is drawn with a fixed amount of space for each branch so all of the tree will not fit in the window. This is a useful tool to check out the tree but there are better tree drawing programs like FigTree that we will use to draw the tree for publication quality images.
You do have the option to save this tree as PNG format or PDF format (under Image on the toolbar). Another option that we will use today is under the File tab choose Export Current Tree (Newick). The treefile will be written in the accepted standard text format for trees. It is called Newick format or New Hampshire format. Newick is the name of a restaurant where the format was devised. The format is a series of parentheses, sequence names and distances. It looks like this:
(Bovine:0.69395,(Gibbon:0.36079,(Orang:0.33636,(Gorilla:0.17147,(Chimp:0.19268, Human:0.11927):0.08386):0.06124):0.15057):0.54939,Mouse:1.21460);
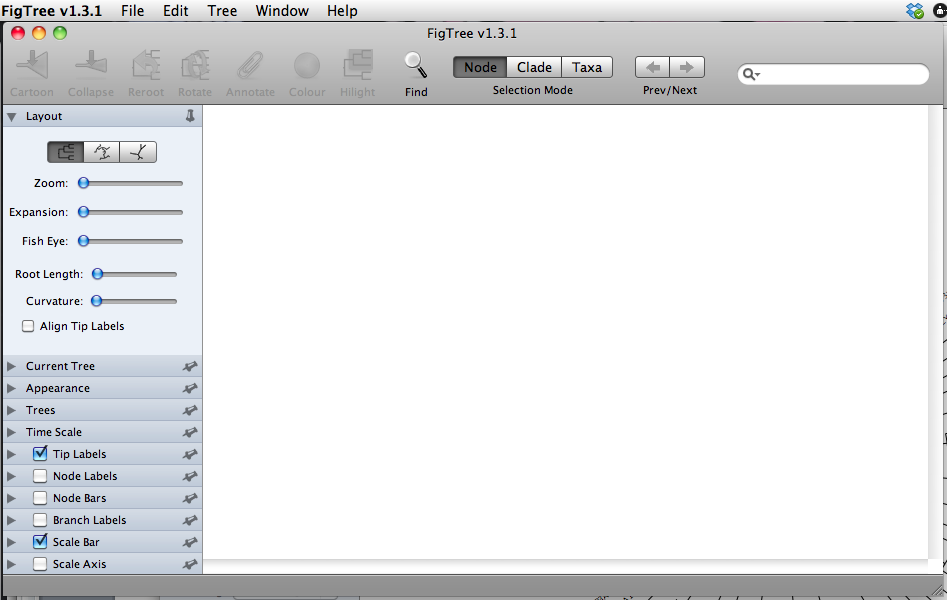
Open FigTree from your desktop link. The FigTree main window looks like this:
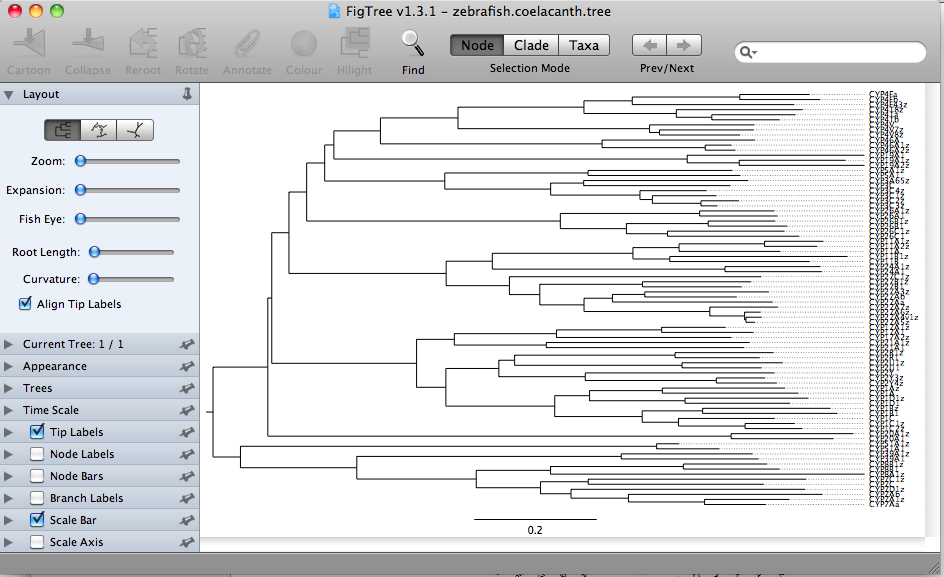
The Figtree file option will open your Newick format file saved from MEGA and display it as a tree in the main window.
The format buttons on the top left allow switching between rectangular trees, circular trees,
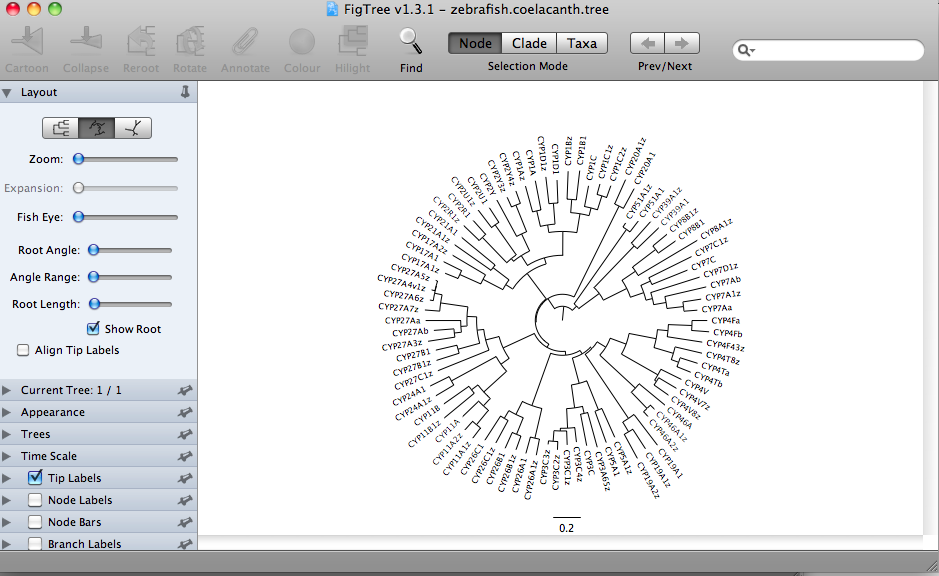
or radial tree formats.
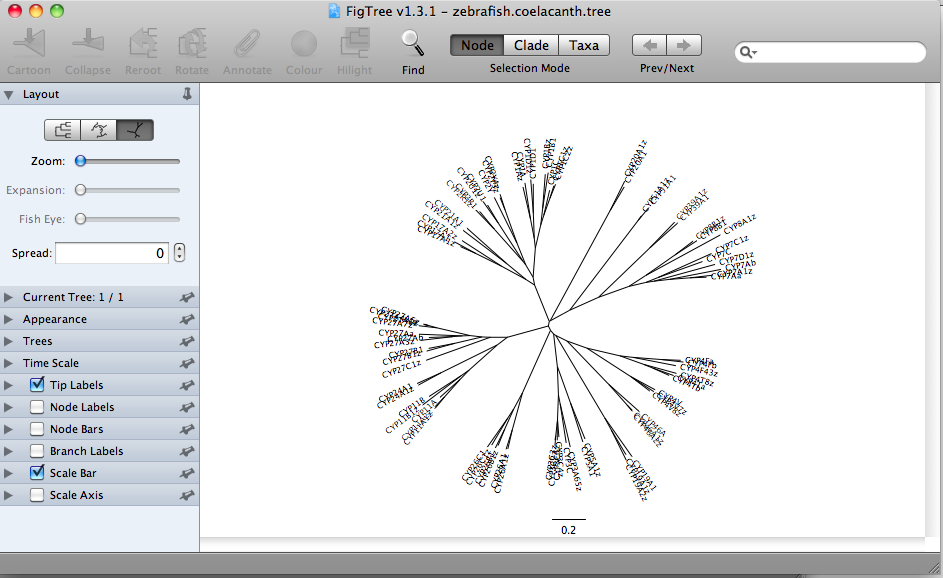
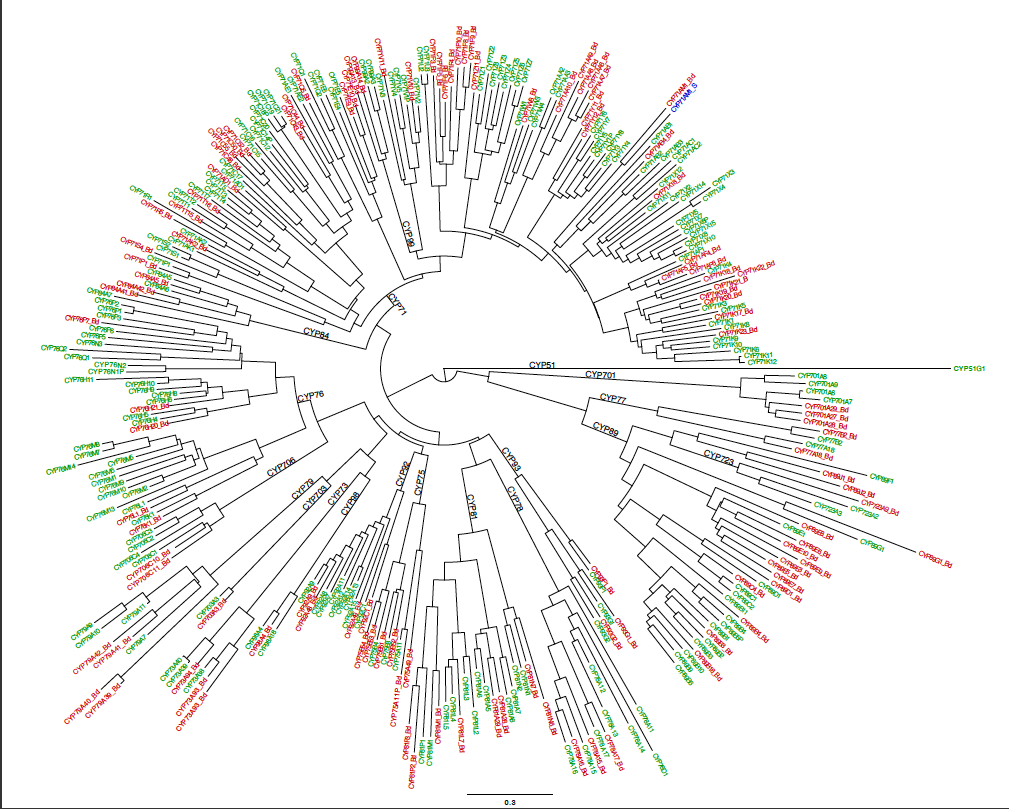
These all represent the same data. This is a Neighbor-Joining tree, so by definition it does not have a root assigned. The rectangular format draws the tree with a clear root (the deepest node). This is misleading. The radial tree does not make any root obvious, so it may be a better choice. The circular tree is my favorite. It allows you to put many sequence on one figure without crowding. I have made trees with about 300 sequences in circular format. The circle format also has a deepest branch which can be viewed as a root, but this is not as obvious as the rectangular format. Here is a finished tree drawn with FigTree and labeled further in Illustrator. The tree has 303 rice and Brachypodium distachyon (another grass) sequences.
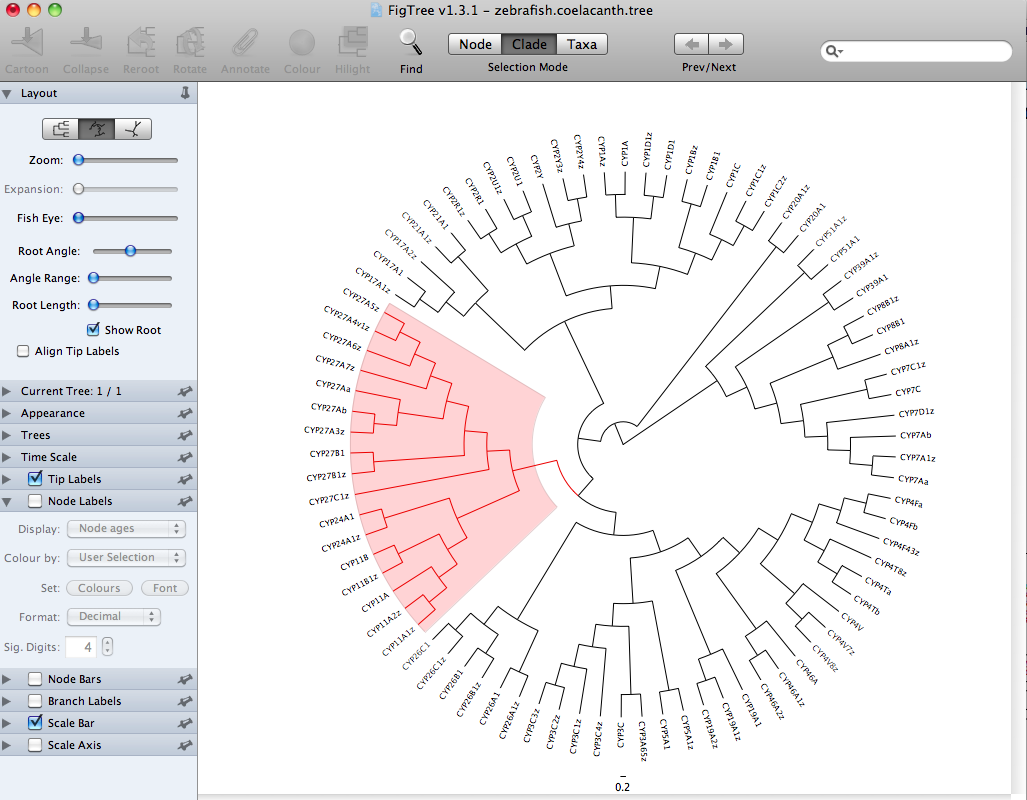
By selecting Clade on the toolbar, it is possible to color the branches of a whole segment or clade of the tree with the color button on the toolbar. You can also highlight that same segment using the highlight button on the toolbar. Labels on the tips of branches (taxa) can also be colored.
Considerations when building trees.
Trees are adversely affected by having partial sequences included in the alignment. These can skew the difference matrix and cause the clustering of sequences to be off. If two partial sequences are in the alignment and they do not overlap, the distance between them will be 100% even though that is not realistic. It is best to delete such short sequences. A sequence that is mosly complete (>70%) can be left in the alignment. It is up to you to make decisions like this that will have effects on your trees.
Assignment 4 Making Trees
The Neighbor Joining method: Saitou and Nei (1987), Mol. Biol.Evol. 4:406
PAUP: Phylogenetic Analysis Using Parsimony a sophisticated parsimony program.
PAUP
PHYLIP: PHYLogeny Inference Package
PHYLIP
MEGA: Molecular Evolutionary Genetics Analysis
MEGA
MrBayes is a program for the Bayesian estimation of phylogeny.
MrBayes
MacClade discrete-state parsimony methods (including DNA and protein parsimony)
For Macintosh computers
MacClade
more links to other software
even more software
I have made a FASTA format sequence file of 34 Coelacanth sequences and 48 zebrafish sequences. Take the file and paste it into a text file using Notepad. Word text files do not work for import into MEGA. Open the FASTA file in MEGA and align it and compute a Neighbor-Joining tree (following the step-by-step procedure outlined in the notes above. Present it as a circluar tree format.
Use Figtree here or Download Figtree to your home, office or lab computer and open the treefile with Figtree. You can export the Figtree tree image as a pdf. Look for alternating Coelacanth and zebrafish sequences in the alignment. This is what would be expected if there were a 1:1 correspondence between the two species. Where does this alternation breakdown? Email me your tree and your comments on the differences between Coelacanth and zebrafish. This is not a trivial assignment with a test set of data. This is real data that has not ever been published, some of these Coelacanth sequences were found in this class in 2012. Good luck. References
Phylogenetic Trees made easy. A How To Manual. Barry G. Hall 2011 edition.
The UPGMA method: Sneath, P. H. A. and Sokal, R. R. (1973) in Numerical Taxonomy, pp. 230-234, W. H. Freeman and Company, San Francisco, CA, USAPackages for phylogenetic inference
MOLPHY: A Computer Program Package for Molecular Phylogenetics
ProtML is the main program in MOLPHY for inferring evolutionary trees from PROTein (amino acid) sequences by using the Maximum Likelihood
method.
MOLPHY
ClustalW server